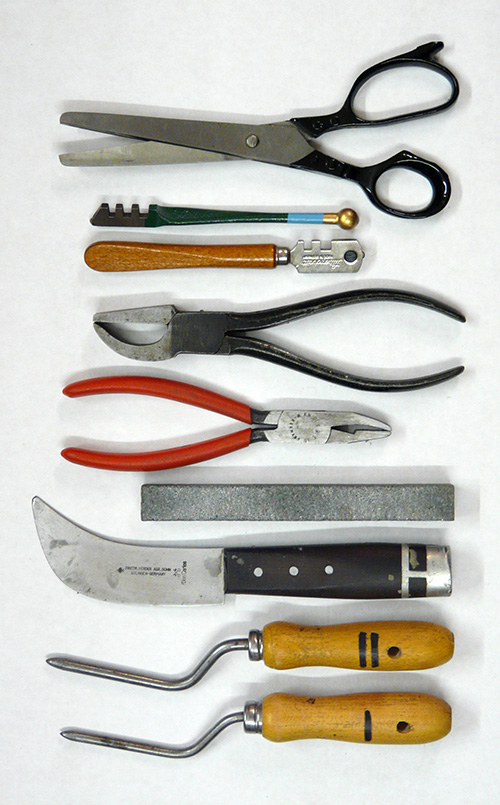
Tools
Here are some tools I use for data analysis... |
 |
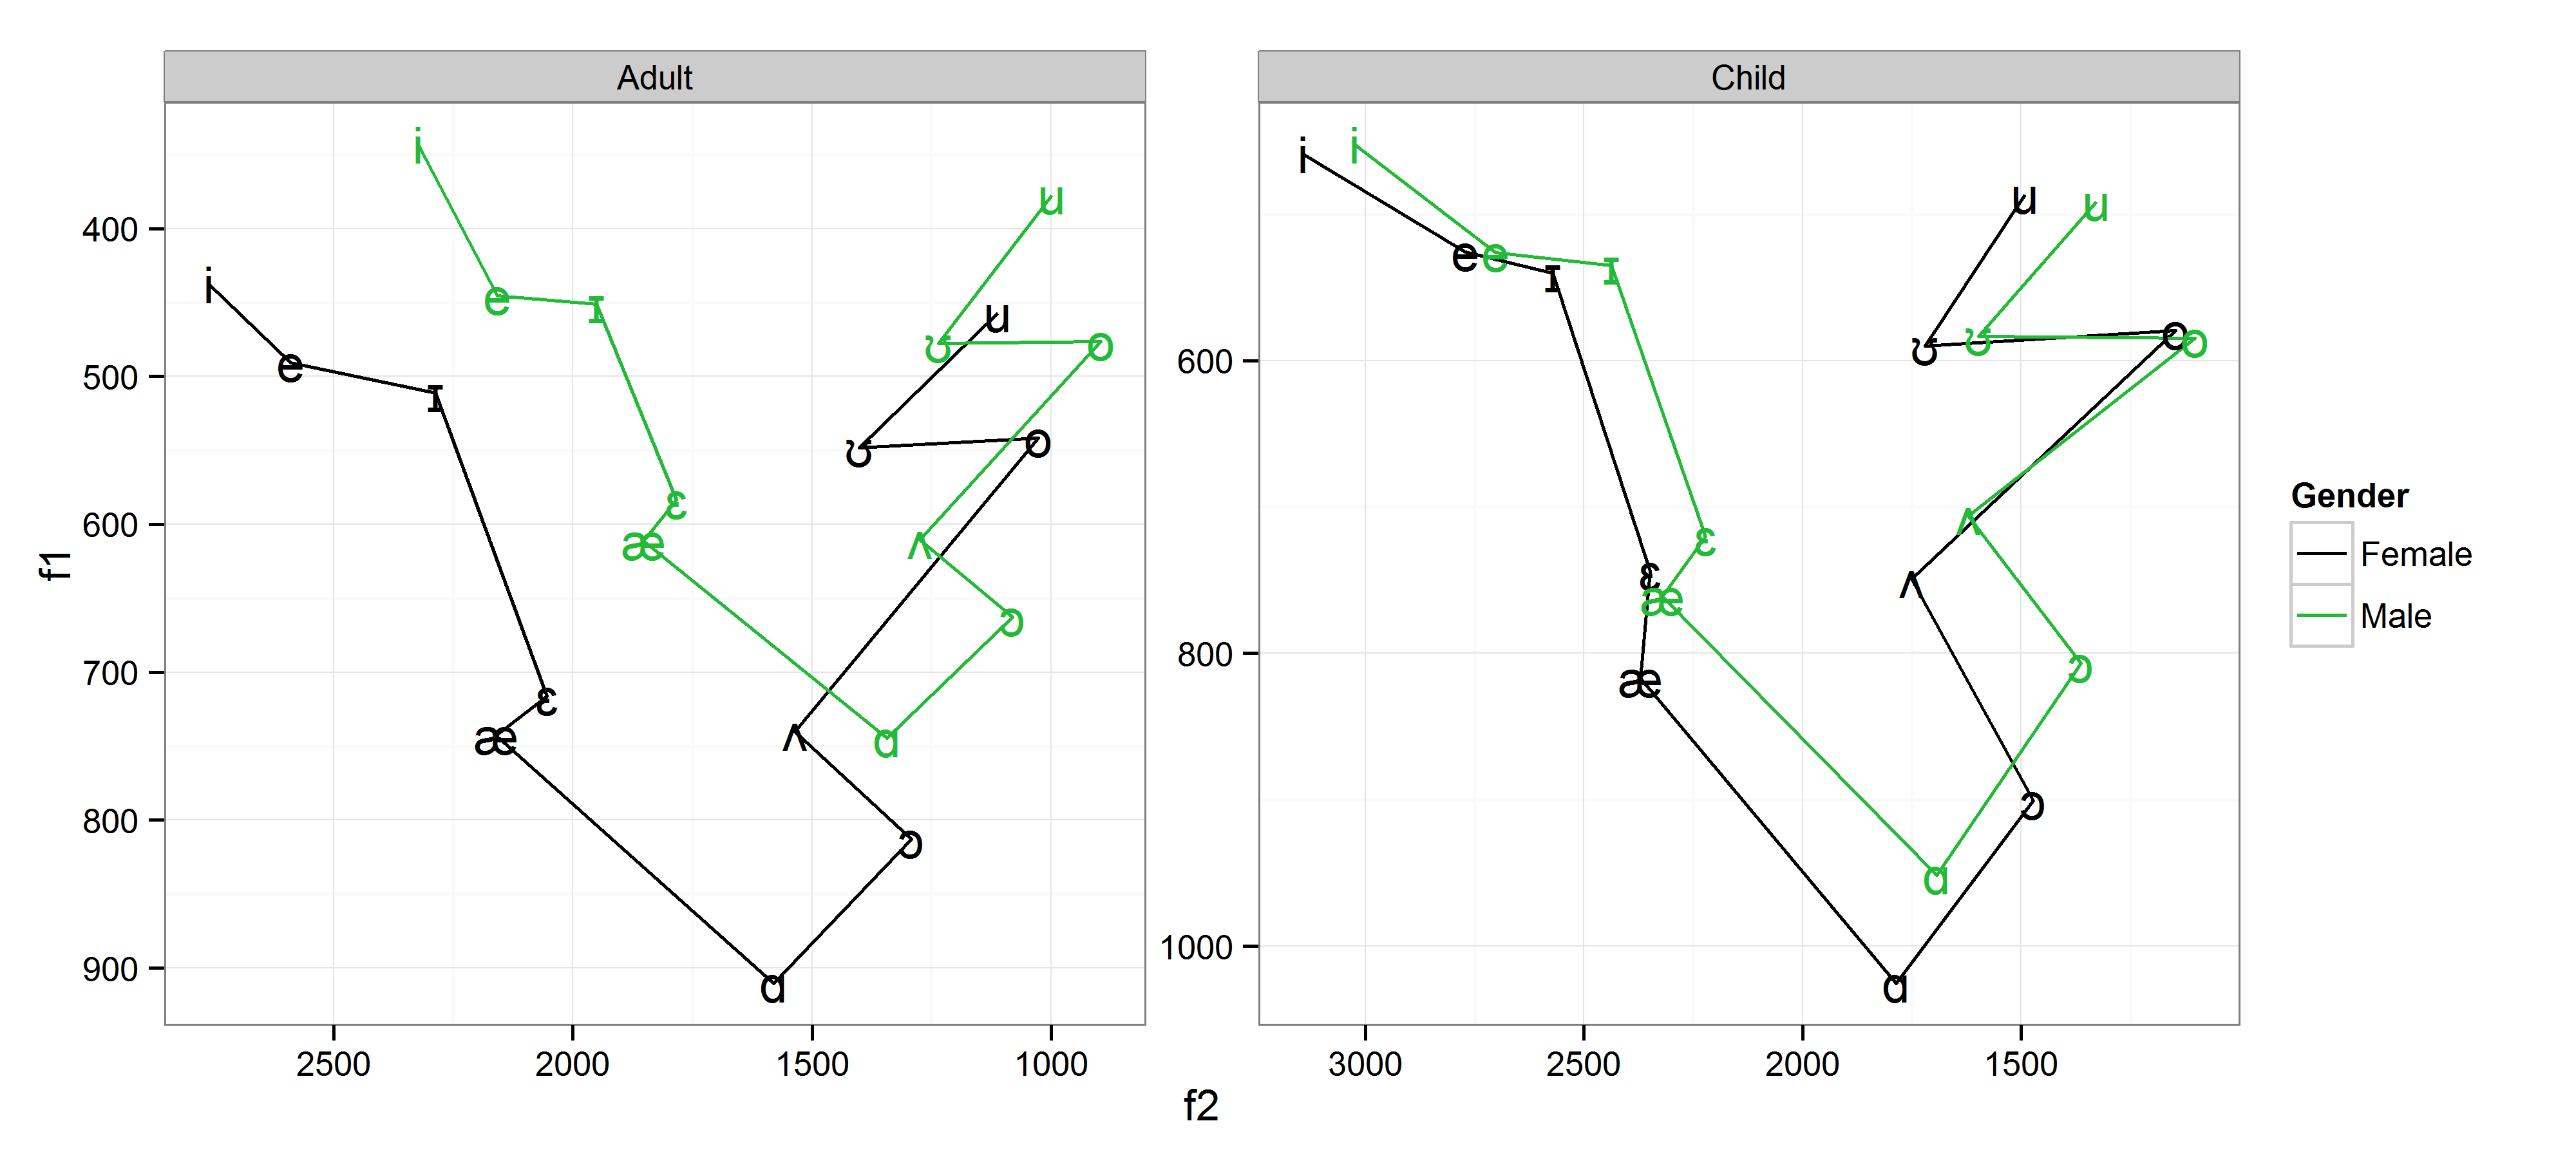
Processing and plotting acoustic meaurements of vowels using R
Part 1 - processing the data
Part 2 - plotting the data
==================================================
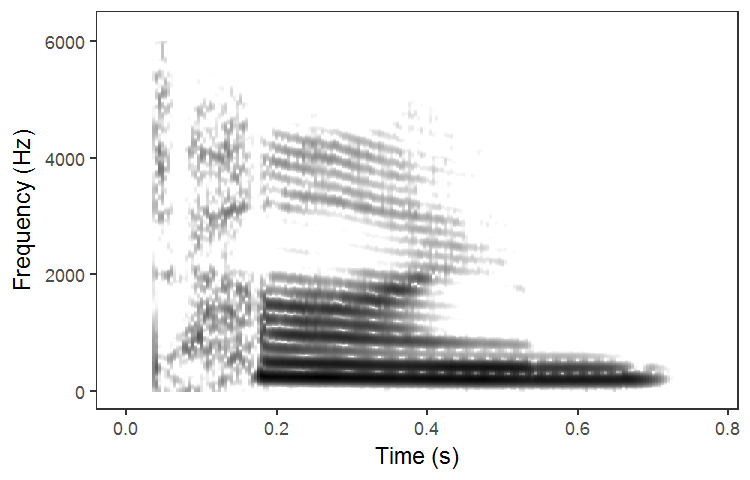
Reading in a Praat Spectrogram into R
==================================================
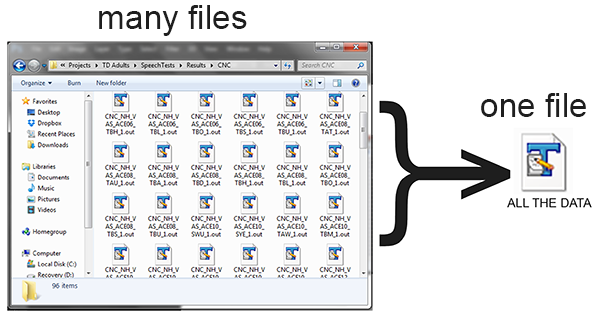
Use R to compile all of your small data files into one big data frame
==================================================
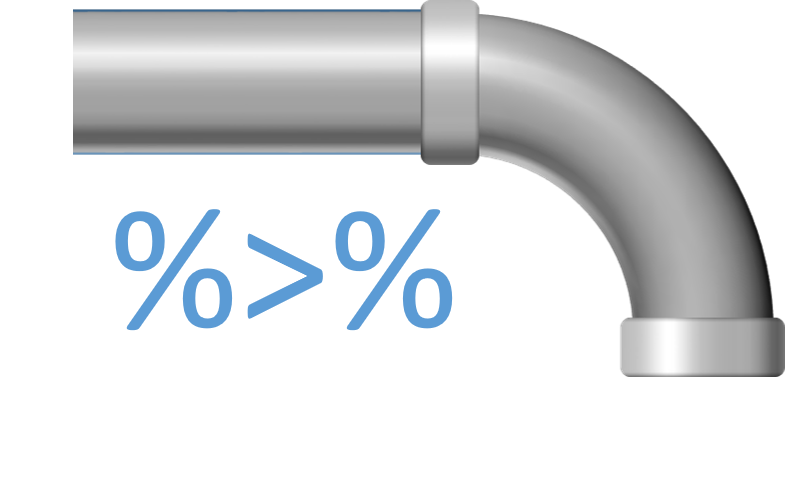
using Pipes and Layers in R to help your data processing and plotting
==================================================
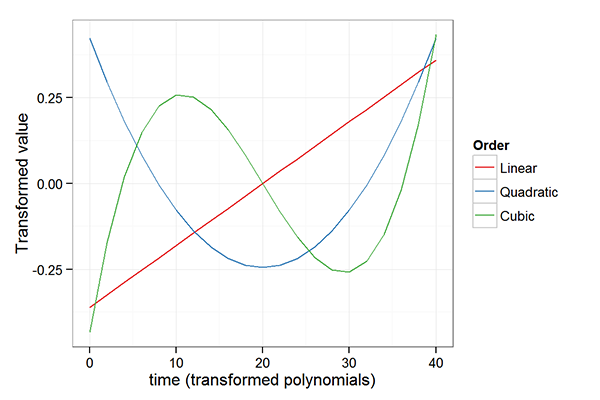
Add polynomial terms to your data frame for growth curve analysis
==================================================
Tutorial on growth curve analysis
==================================================
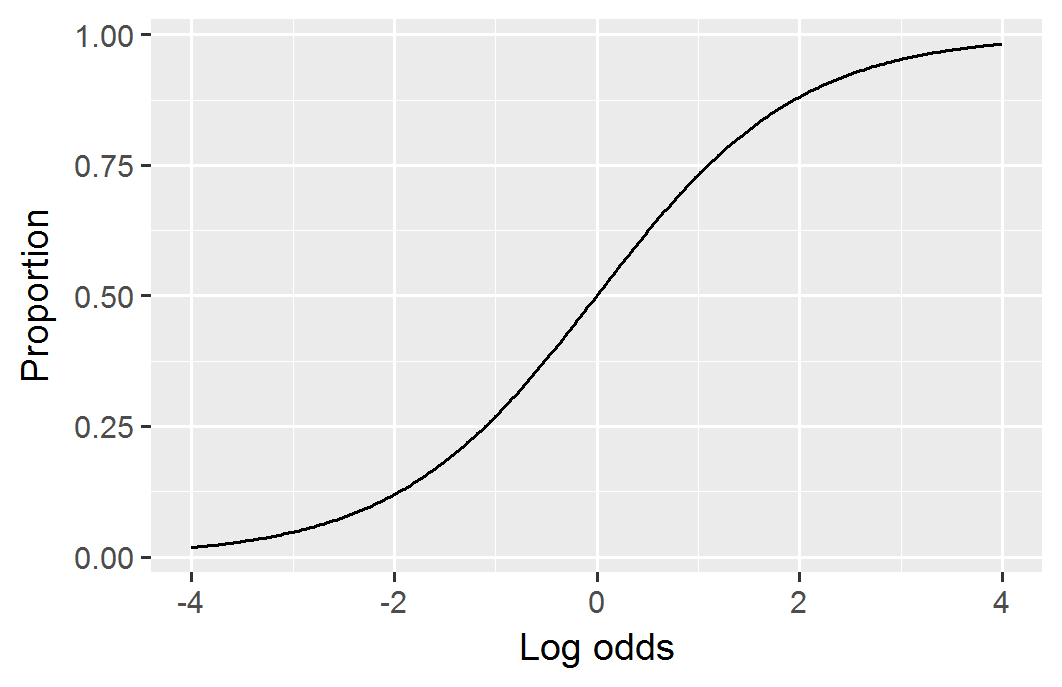
Convert Log odds to proportion in R
==================================================
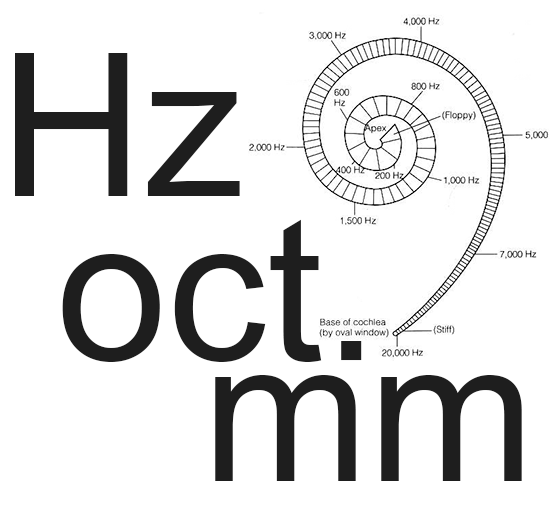
Convert sound frequencies to various scales
(convert frequency difference to octave diff
or cochlear space difference, etc)
(an excel file)
==================================================
==================================================
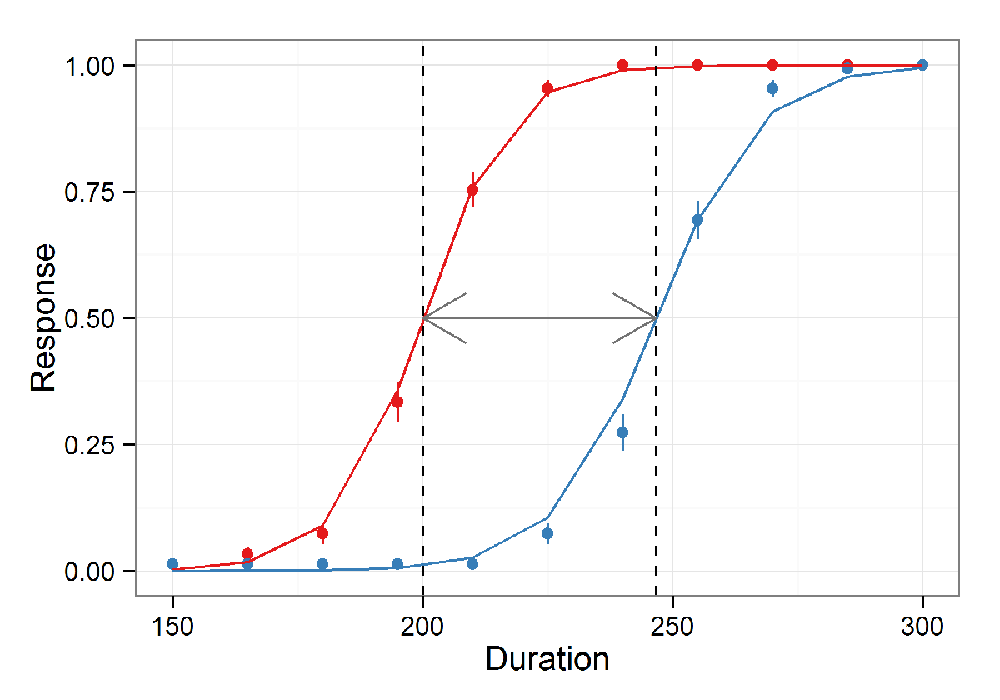
Observe context effects in identification functions
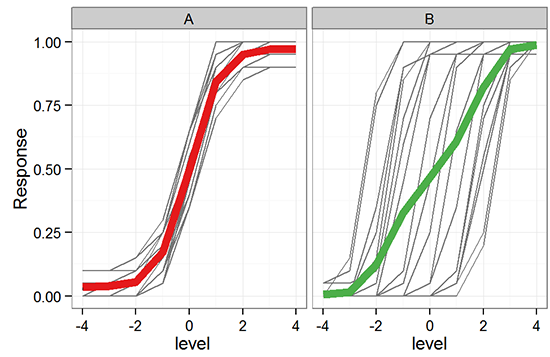
See how random effects structure can help to estimate fixed effects
(return to top)